skateboy___918
Ready to race!
- Location
- Boston, MA
could you redo the graphs using RPM as the x-axis and temp as the y-axis?
great review though!
great review though!
could you redo the graphs using RPM as the x-axis and temp as the y-axis?
great review though!
could you redo the graphs using RPM as the x-axis and temp as the y-axis?
great review though!
Thanks!
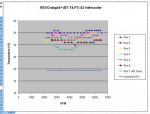
The RPM is already on the x-axis, and the IATs already on the y-axis (left). The y-axis on the right shows RPMs again, but is used only for the RPM vs. frames plot. Because every data point captured within VCDS corresponds to a unique RPM reading, the RPM plot could be read as RPM on the y-axis (right) and data frame on the x-axis.
For the IAT plot, it references the temperature values on the y-axis (left) and the RPMs on the x-axis.
Sorry if this wasn't more clear! I guess I should have labelled the axes.


Can you do a closer clear picture of the fins please