itisagoodname
Ready to race!
- Location
- Bay Area, CA
- Car(s)
- '08 G37S
Okay... sparked by the Forge WG thread ive been on a mini quest for some knowledge about turbo's. From everything i've read i believe that i now have a slight grasp on what i have been looking for.
PLEASE, anyone out there that knows a great deal about the subject of turbo efficiency, please chime in and correct me where i'm wrong.
If i am really that far off i will in fact take down this thread. I am looking for feedback to determine if i am on the right path
A brief intro to compressor maps:

Since i'm in CA, the air density i am using is at sea level; 0.076lb/ft3
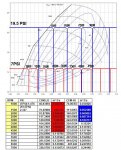
With the k03 maps i could find online, i made up an overlay of points for the efficiency of the k03 on the FSI 2.0L motor.
Where L = engine capacity in liters 2.0
RPM = maximum engine speed (we'll adjust this later) 7250
VE = engine volumetric efficiency. From A. Graham Bell's book Forced Induction Performance Tuning some good values for VE are:
Stock 2-valve = 85%
Stock 4-valve = 90%
Street modified = 93%
Competition = 105%
Pr = pressure ratio
Pr=Pr = (14.7 + Boost)/14.7
CFM = (L x RPM x VE x Pr) / 5660
1 (cubic meters) per second = 2118.88 (cubic feet) per minute
1 (cubic feet) per minute = 0.000471947443 (cubic meters) per second


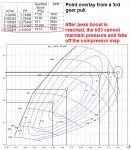
From this you can see that the k03 is NOT meant to flow anything but hot air once the turbo is out of its efficiency range (choke area)... From this we see the reason IAT's rise the way they do and the true benefit of an intercooler.
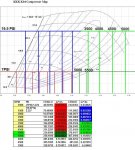
I am currently looking to overlay this data on a k04 map as well
k03 vs k04

The benefit of a K04!!!

PLEASE, anyone out there that knows a great deal about the subject of turbo efficiency, please chime in and correct me where i'm wrong.
If i am really that far off i will in fact take down this thread. I am looking for feedback to determine if i am on the right path
A brief intro to compressor maps:

The vertical axis is the pressure ratio.
Pressure Ratio=The pressure at compressor exducer vs the pressure at compressor inducer.
In another word, the ratio of the pressure of the air after compression vs the pressure before compression. As you can see, the pressure ratio depends on the ambient pressure. For example, at sea level, a turbo boosts 14.7psi. Ambien pressure is 14.7psi. That's 2 pressure ratio (PR) on the compressor map. Take that turbo to a higher elevation, the ambient pressure is less than 14.7psi. If the turbo still boosts 14.7psi, the pressure ratio would be higher. Now on the compressor map, you will see by moving up along a vertical line (to pump out the same cfm) and turbo efficiency has decreased as the elevation increases (PR increases). Simply put, turbos lose performance and become less efficient as elevation gets higher.
The area to the right of the outer most elliptical circle is the least efficient area, choke area.
It means when the compressor reaches certain rpm, the air moved by the compressor wheel in the diffuser area of the compressor housing is moving at or past the speed of sound. When the air speed reach sounic speed, the amount of air flow increase is very small as compressor wheel rpm increases. In plain words, the compressor has reached its limit. You can try to pump more psi, have to wheel spin faster, but very little more air is pumped out the turbo compressor. You can see now, the compressor housing will need to properly match the compressor wheel. If you simply stuff a big wheel inside a small compressor housing, the diffuse area will be very small. This causes the air inside the housing to move at higher speed. That's why some of the so-called T28s which use a bigger compressor wheel inside the stock compressor housing does not produce good hp.
Compressor Max Flow
The max flow of a compressor is shown on the compressor map. On the map, look for the interception of maximum compressor wheel speed (rpm) and the least compressor efficiency curve. Find that interception. The horizontal coordinate is the max flow.
The area to the left of Max Flow is 'choke area'.
The vertical coordinate is the pressure ratio at which the compressor reaches that max flow. From this boost level, as the boost increases, very little air flow is increased. For example, if a compressor reach max flow at 2 PR or 1 atm pressure or 14.7psi, higher boost does not pump more air into the motor. But higher boost may be needed to increase the manifold pressure for the motor to flow more air. A 5 liter motor with this turbo needs 15psi of manifold pressure to flow a certain CFM. A 3 liter motor with the same turbo will need much higher manifold pressure to flow the same amount of air although that turbo's compressor does not flow more air past 14.7psi.
Compressor Max Pressure
On the map, find the top-most point on the graph. The vertical coordinate is the max pressure ratio. For example, 2.8 pressure ratio at sea level is 1.8 times the atmospheric pressure, 1.8x14.7psi=26.46 psi.
Compressor max pressure is limited by compressor wheel speed. It's physically impossible to boost higher than this max pressure for one particular turbo. Plus the pressure drop in the intercooler system, the actual max boost reading from a boost gauge that's plugged into the intake manifolds maybe a few psi lower than this max pressure.
Since i'm in CA, the air density i am using is at sea level; 0.076lb/ft3
With the k03 maps i could find online, i made up an overlay of points for the efficiency of the k03 on the FSI 2.0L motor.
Where L = engine capacity in liters 2.0
RPM = maximum engine speed (we'll adjust this later) 7250
VE = engine volumetric efficiency. From A. Graham Bell's book Forced Induction Performance Tuning some good values for VE are:
Stock 2-valve = 85%
Stock 4-valve = 90%
Street modified = 93%
Competition = 105%
Pr = pressure ratio
Pr=Pr = (14.7 + Boost)/14.7
CFM = (L x RPM x VE x Pr) / 5660
1 (cubic meters) per second = 2118.88 (cubic feet) per minute
1 (cubic feet) per minute = 0.000471947443 (cubic meters) per second


From this you can see that the k03 is NOT meant to flow anything but hot air once the turbo is out of its efficiency range (choke area)... From this we see the reason IAT's rise the way they do and the true benefit of an intercooler.
I am currently looking to overlay this data on a k04 map as well
k03 vs k04

The benefit of a K04!!!

Last edited: