...No doubt a suspension engineer could look at those and tell you a lot more.
hehe... how can I be of service? :biggrin:
ask away.
I'll will a bit of info... this "report" is
super shady.
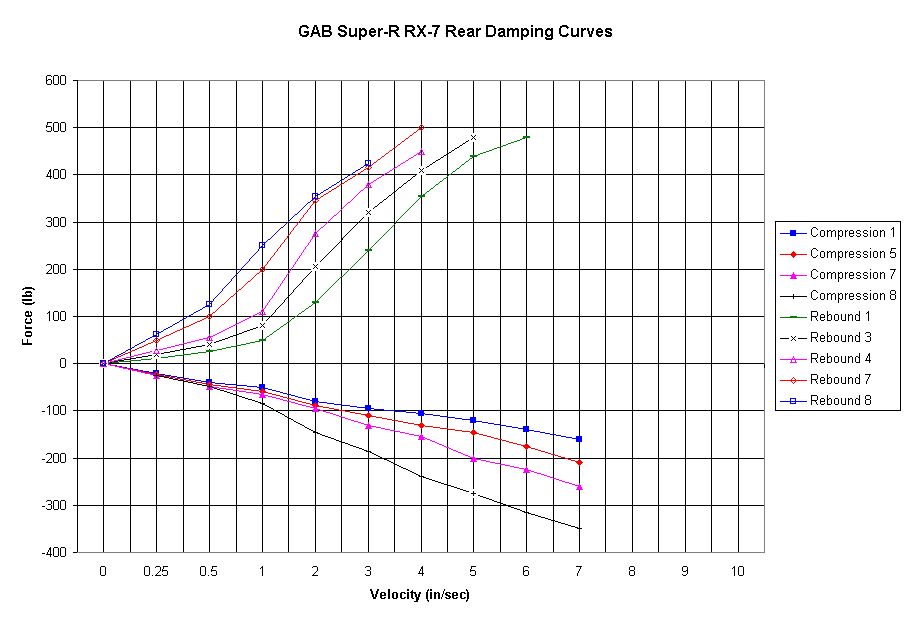
The graphs are bogus, btw... the data may be good, but the labels and range are wrong.
.2 M/sec = 7.87 in/sec WAYYY to high of a velocity to start reporting data. From plotting the info, it would appear that they have a digressive valving. The nose/knee and blow-off data are not there.
If you just evaluate the lines... by just looking at it, crap-ton of compression, very little rebound. Of course as Boston said the inverse (and is correct) the graphs are reversed from what is common practice :bonk: and is reported incorrectly. Gas pressure seems to still be in there, so dampening is actually going to be lower (skewed) than what is indicated (real life application just feels like more spring rate and can shift the graph).
The graph is force vs displacement and not force vs velocity (which would have told you more about the damper). The adjusters are below average grade and have considerable cross-bleed (rebound adjustment affects compression), but tolerances have to be insane (Penske, Ohlins, Dynamics, etc) to be consistent. I'd love to see a force vs velocity chart. The waviness suggests that there is some hysteresis there, but instead of graphing velocity, they just give you some numbers. NO WAY do these have a balanced canister or head valve.
Overall, it really does not tell you crap due to it's lack of credibility stemming from sporadic data.